Software development
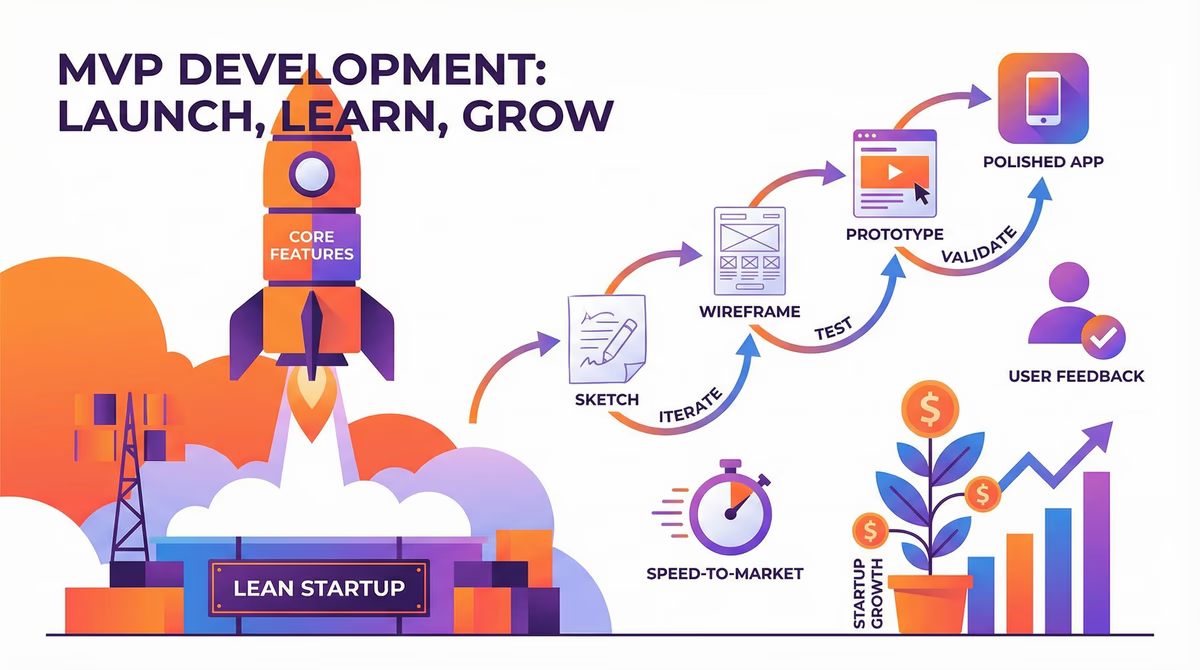
What is a MVP and why is it so important?
♪ From the idea to the MVP: Realistic cost planning > > The path from a brilliant business idea to a functioning product is exciting and full of challenges. One of the first un...

Compare a lower external hourly rate with the actual coordination, handover and QA effort versus a German development team.
In brief
The investment frame is EUR 43,659 – 1,088,388 excl. VAT. Team size and duration change the comparison frame.
The calculation follows six visible stages. All figures remain planning values until scope and assumptions have been reviewed.
1. Capture inputs
The calculator records the visible project, volume, complexity and operating parameters selected on this page.
2. Add fixed components
Fixed base modules and selected add-ons are added without mixing them with recurring charges.
3. Apply multipliers
Quantity, complexity and scope factors multiply only the cost components identified for them in the calculator model.
4. Create the range
The calculator applies its documented lower and upper uncertainty factors to the base result; ROI views keep investment and savings visible separately.
5. Round and calibrate
Monetary result fields are rounded to the nearest whole euro. Public project-cost components are calibrated with the centrally maintained display factor.
6. Classify the result
The result is shown as non-binding guidance. A binding quote requires scope, data, integrations, risks and acceptance criteria to be reviewed.
Efficiency or discount factor: A central display factor of 0.7 is applied to public project-cost components to keep all calculators aligned with the currently reviewed pricing basis. It is not a customer-specific discount; customer-entered wages, revenues and existing operating costs are not reduced.
Why this is not a binding quote: The calculator cannot verify complete requirements, third-party dependencies, data quality, legal constraints or acceptance criteria.
Concrete project profiles with assumptions and indicative budgets—useful for internal alignment alongside the calculator.
The upfront cost can be spread over 72 months. Terms are on the software financing page.
Calculator overall range
EUR 43,659 – 1,088,388 excl. VAT
The overall range is derived from the valid parameters of the relevant cost calculator.
Typical duration
Projects from 3 to 12 months
Main risk drivers
Non-binding indication
This result is only a non-binding indication based on typical assumptions. Effort and price must be calculated individually for your project.
Or call us:+49 491 960 999 00
FAQ
Nearshore works well with stable requirements, English documentation and strong technical ownership.
The calculator adds communication and rework to the lower external rate.
The same capacity is compared with a German delivery team from Groenewold IT.
Coordination raises the nearshore effort inside the comparison frame. We do not publish an hourly rate.
Detailed specifications, handovers, reviews, onboarding, quality assurance and supplier turnover can materially change the total cost.

Unclear domain rules, rapid product decisions and critical legacy systems often require more direct contact than a distributed model provides.
Yes.
Keep architecture, product ownership and acceptance local while assigning clearly scoped packages to external specialists.
Groenewold IT delivers Made in Germany from Leer, East Frisia.
Direct contacts and shorter feedback loops can outweigh a higher hourly rate.
| Model | When it fits | Budget & flexibility | Typical risks |
|---|---|---|---|
| Fixed price (fixed scope) | Clearly defined scope, stable requirements, repeatable delivery. | Predictable total cost; little room for change without a change order. | Scope creep leads to change orders or quality trade-offs. |
| Time & Material | Discovery, legacy, evolving requirements, or close collaboration. | Maximum flexibility; budget transparent via hourly or daily rates. | Without prioritisation, effort can grow—backlog and reviews matter. |
| Retainer / maintenance package | Ongoing operations, updates, small features, and support. | Agreed capacity per month; predictable follow-on cost. | Large changes may still need a separate estimate. |
| Hybrid (milestone + T&M) | MVP or phased releases with clear go-lives, then iterate. | Core delivery fixed price; extensions on a time-and-materials basis. | Define contractually what is in scope vs. extra work. |
Calculators on this page provide indicative ranges; we choose the right model with you based on risk, scope, and planning horizon.
The ranges shown are indicative. For a binding quote we discuss scope, priorities and funding options in a free intro call. Many digitalization projects qualify for grants – try our funding calculator.
Browse all cost calculators, explore services and typical solutions. Questions about nearshore comparison? Contact us.
After using the nearshore comparison calculator, validate assumptions in a short intro call.
Browse all cost calculators in the costs overview.
What is the total delivery cost?
Interactive estimate based on your inputs.
Non-binding project range from the software cost calculator: EUR 10,332 – 372,623 excl. VAT.
Methodology: The estimates are based on historical project data, complexity drivers and standard implementation assumptions. Results are a non-binding indication only; effort and price must be calculated individually.
If you are still deciding
If you are ready to implement
A transparent four-step process for validating the Nearshore cost comparison indication with concrete requirements.
1. Confirm scope and target outcome
We clarify the business outcome, user groups, and boundaries relevant to Nearshore cost comparison.
2. Review data, interfaces, and risks
We validate integrations, data quality, security, compliance, and operational dependencies.
3. Check the calculator assumptions
We compare the selected parameters with the real system landscape and document deviations.
4. Prepare the precise quote
You receive a scoped proposal with milestones, exclusions, price model, and next decision point.
Blog posts that put budget, effort and typical project paths for this calculator in context.
What is a MVP and why is it so important?
♪ From the idea to the MVP: Realistic cost planning > > The path from a brilliant business idea to a functioning product is exciting and full of challenges. One of the first un...

How to connect your company systems for sustainable success
In today's business world marked by digital transformation, data is the undisputed elixir of life of every company. They are the basis for innovation, efficiency and sound...

Venture Capital for Software Development: Opportunities and Risks
In the dynamic world of software development, access to capital is often the decisive factor that decides on the success or failure of an innovative start-up. One of the famous...